Getting started
Crucible is a test bench for the Alchemy API. You write a request, send it, and look at what came back as a table, as a schema, and on a map. What you enter stays in your own browser, and a run only ever sends the request and shows you the response.
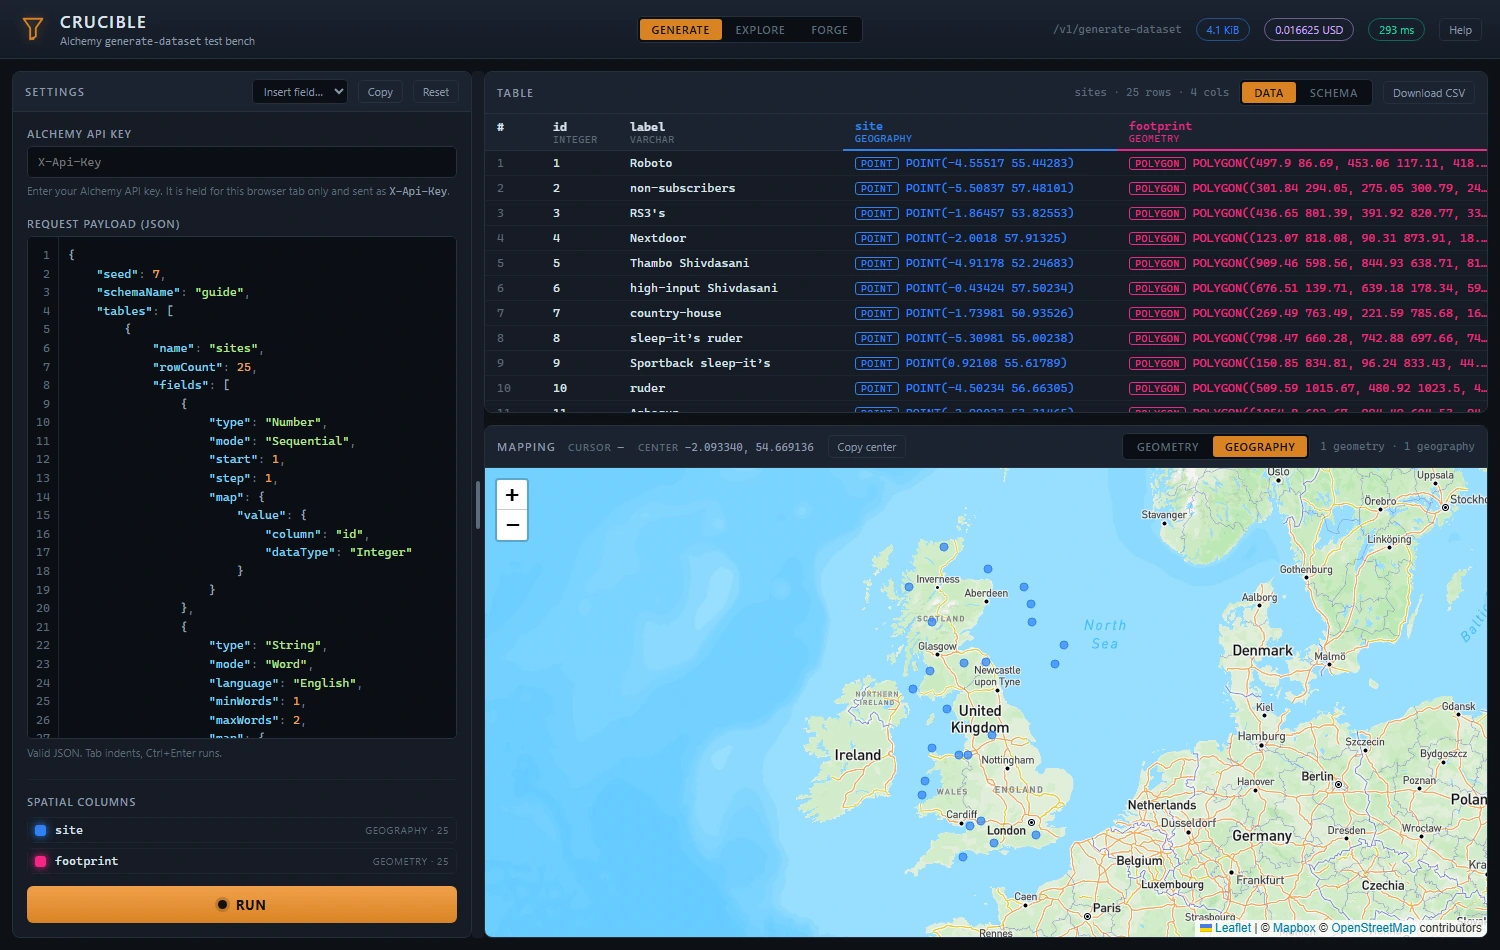
The bar across the top switches between three workspaces.
- Generate posts a JSON payload and fills the Table and Mapping windows from the response.
- Explore calls the reference, address and account lookups, which take parameters rather than a payload.
- Forge builds a polygon by hand, for use as a spatial filter in a payload.
The API key
Every call needs an Alchemy API key. Enter it in the box at the top of the Generate
workspace, where it is sent on as the X-Api-Key header. The same key is used by
Explore, so it only has to be entered once.
The key is held for the browser tab alone. It survives a reload and is gone when the tab closes. It is never written to disk and never appears in a URL.
What this guide does not cover
This guide is about Crucible, not about Alchemy. What the field types mean, which options each generator takes, what an endpoint returns and how usage is billed are all questions about the API itself, and they are answered by Alchemy's own documentation rather than here. Crucible only ever shows you what the API said.
The top right
The masthead carries the path of the endpoint in use, then a pill for each thing worth knowing about the last run.

- The status pill reads
Idle, thenGeneratingwhile a call is in flight, then how long it took. It turns red, and names the failure, when a call did not succeed. - The bytes pill, in blue, is the logical size of the data the run generated, as the response reported it.
- The cost pill, in purple, is what the call was charged, in the currency the response named.
Both figures come from the response. Neither is calculated here.
Generate
The Settings window on the left holds the key and the request body. Run sends it and fills the two windows on the right. Ctrl+Enter does the same from anywhere in the app.
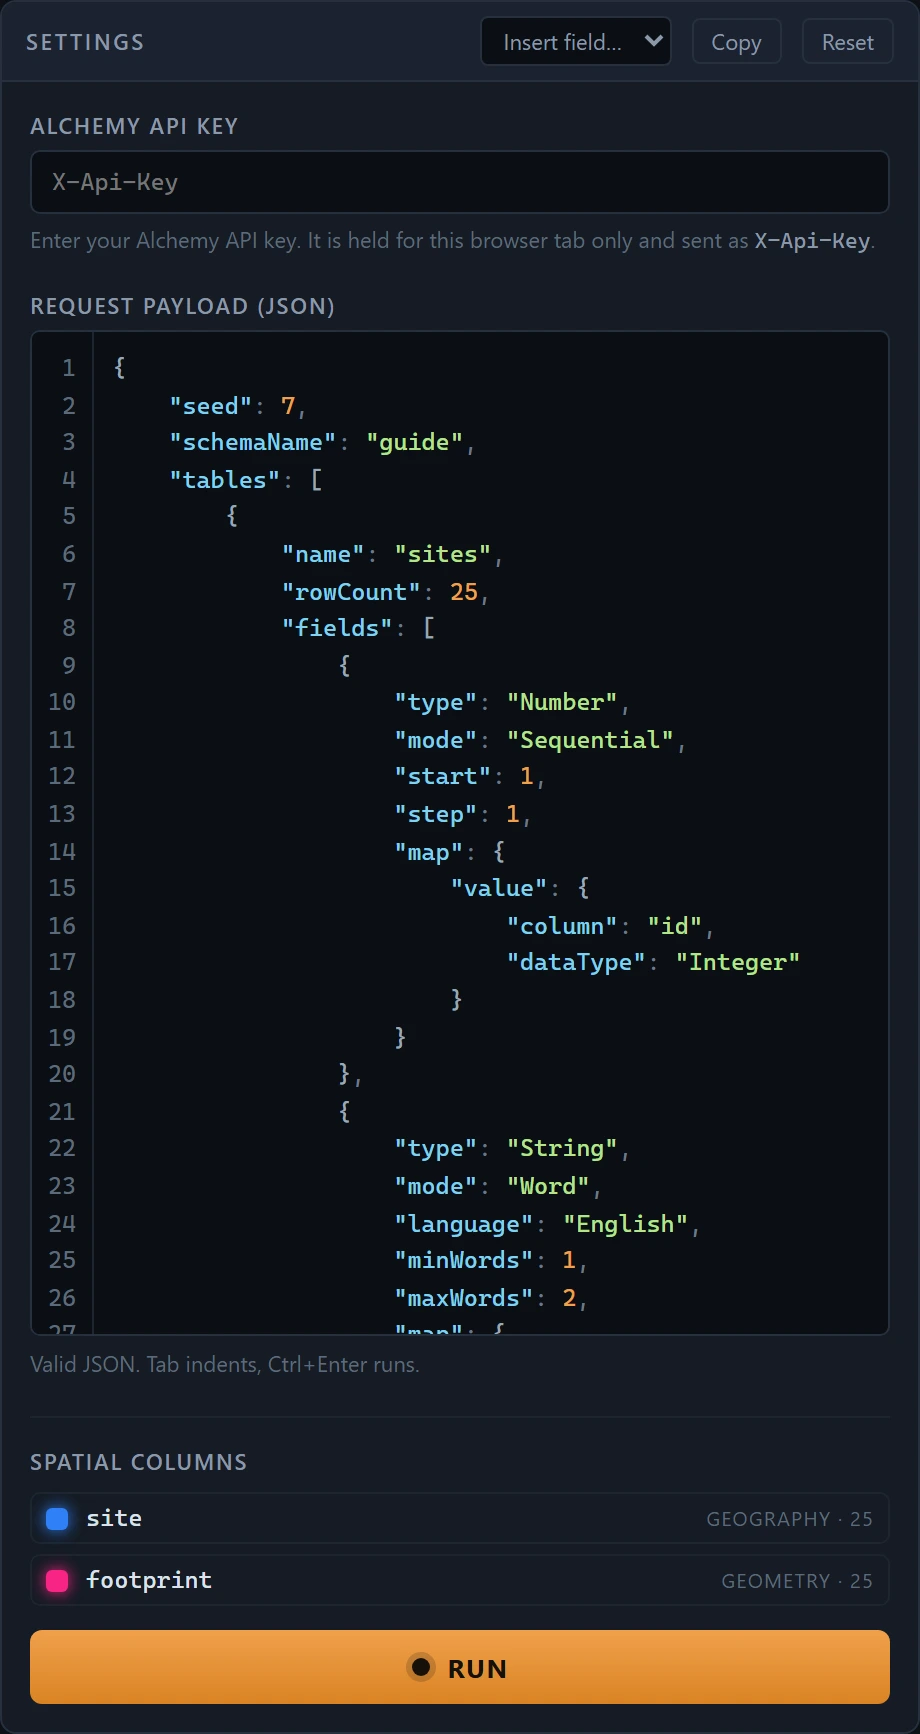
The payload editor
The box takes the JSON request body, colored and numbered as you type. The line under it tells you whether what you have written parses, and names the error as soon as it does not. That check is about JSON alone. Whether the API accepts the payload is only known once it has been sent.
- Tab indents by four spaces and Shift+Tab outdents. With text selected, whole lines move together.
- Insert field drops a working starter field for any generator after the last field already there, not wherever the cursor happens to be. With more than one table it adds to whichever table's field list the cursor is currently inside. It only works while the payload parses, and does nothing otherwise. In the Outline view, where there is no cursor to speak of, it opens a guided dialog instead of dropping raw JSON — see below.
- Insert table opens a dialog for a new table's name, row count and an optional primary key, and adds it after the last table in the payload. Always a dialog, in either view — a table has no per-type shape for the JSON view to drop in directly the way a field does. See below.
- Dataset opens a dialog for the payload's own top-level settings and CSV formatting. Unlike the other two, it edits what is already there rather than adding something new — see below.
- Copy puts the payload on the clipboard.
- Reset overwrites the box with a starter payload, an outline of one table with a row count and no fields in it. The old text is gone at once, and the editor's own undo will not bring it back.
The payload is saved as you type and comes back when you return, so closing the tab does not cost you a request you were part way through writing.
The outline
Outline in the window bar shows the payload as a structure instead of as text, and JSON switches back. The two are views of one document, never open at once. A long payload is easier to take in as a list of fields than as a hundred lines of braces, which is what the outline is for.
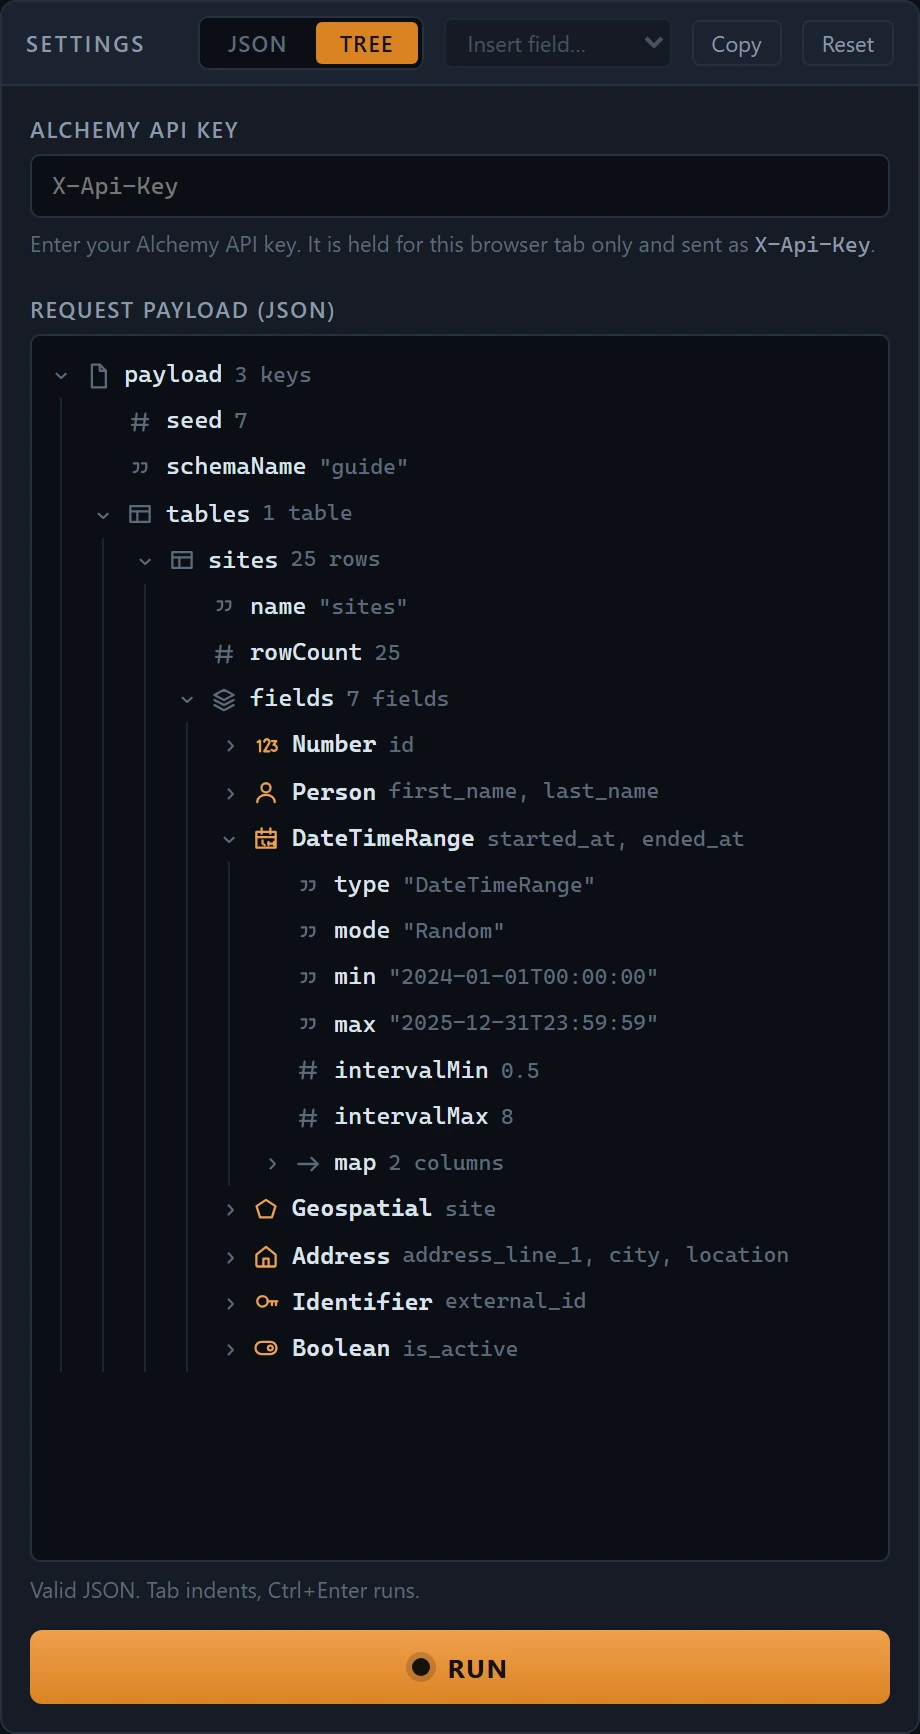
Most of the outline is a read only view — clicking a row selects it, nothing more. A table or a field row is the exception: hover one and two small icons appear at its right edge, one to edit that row's own settings in place and one to delete it. See below. The outline itself is only ever shown while the payload parses: until it does, it says so, and the hint under the editor names what is wrong.
How a row is shown
The document's own shape decides. An entry under fields is labeled by its
generator, carries an icon for that generator, and shows the columns it lands in. A table is
labeled by its name and shows its row count. A mapping shows the column and the type it
writes to. Everything else is shown as what it is, an object, an array or a value, with the
value beside the name.
The icons are meant to be told apart at a glance rather than read: a house for an address, a pin for a location, a key for an identifier, a calendar for a date and a clock for a time, with the range forms marked as spans of the same shape.
Getting around
- Click a row to select it, or the arrow beside it to fold and unfold.
- Double-click a row to jump to it in the JSON. The view switches back to the text and the caret lands on that property, selected, with its line brought to the middle of the box.
- Arrow keys move through the outline, Left and Right fold and unfold, and Enter jumps the same way a double-click does.
It starts open as far as the field list and no further, so a payload with many fields is a list you can read rather than a wall. Folds you make are kept as you keep typing, so the outline does not close up underneath you.
Copy and Reset work the same in either view.
Insert field, guided
Choosing a type from Insert field while the outline is showing opens a dialog rather than dropping raw JSON, since there is no cursor position in an outline for text to land on. At the top is a header of settings that never change shape whatever the field type: a Table dropdown, so which table the field belongs to is settled before what kind of field it is, a Type dropdown seeded with whatever was chosen, and every field's own Unique, Seed and null-percentage range — except for Calculated, which offers neither Unique nor Seed, since nothing about a calculation is random and the API rejects both outright.
Table defaults to whichever table the outline's own selection sits inside, at any depth, and falls back to the first table when nothing is selected or the selection is not inside a table at all. It is disabled rather than removed when the request has only one table, since there is only one thing it could mean. Type is changeable inside the dialog, and changing it rebuilds everything below it for the new type.
Below the header are the settings that type itself takes, and a Map section for the columns the generator can write to. Only a column actually mapped gets a row — Address alone can write to 22 of them, most of which nobody wants for any given field. A picker at the bottom offers whichever ones are not mapped yet; choose one and press Add for a row, already filled in with a sensible column name and data type. The − beside a row takes that one back out and Clear takes them all.
Each row is numbered and carries an arrow to move it earlier or later. That order is the order the columns come out in, so it is worth setting: the row numbered 1 is the first column of the generated table.
Every row also has its own Hidden checkbox. A hidden column is still generated and named, and a Calculated field declared after it can still read it by that name, but it drops out of the CSV and the schema Run shows you — for a first and last name you only wanted in order to build a full name from them, say. Left unticked, nothing is written for it at all.
The form packs two or more short settings to a row rather than stacking everything in one column, widening as far as the window allows before it resorts to scrolling. A setting that needs the row to itself — a weighted list of countries, an identifier's own nested pattern settings — takes it; a setting only shown for the mode currently chosen keeps what you typed in it if you switch away and back, and is skipped by the layout entirely while hidden, so the settings around it still pack together rather than leaving a gap.
A date, date-time or time setting is a native calendar or clock picker instead of a plain text box — Date, DateRange, DateTime, DateTimeRange, Time, TimeRange and Timestamp all have several. Click it to select from the calendar or clock face, or type the day, month, year, hour, minute and second segments by hand the same way you would type into any other box. Interval's own min and max use the same clock picker even though they are a span of time rather than a time of day, since there is no separate picker for that and the digits are typed and read the same way either way.
Timestamp's own Timezones is a row per zone, each one selected from a
dropdown of common IANA zones — (UTC+01:00) Europe/London. The list runs west
to east by offset rather than by name, since a name on its own does not say where the zone
sits, and the offset shown is the one that zone is actually on today rather than a stored
number, so daylight saving is accounted for. A zone set by hand in the JSON view that is
not one of the offered ones is kept and shown as the selected option, so editing the field
here never moves it. Add starts another row and the − button next to a
row removes it.
A Country is always a dropdown showing the country's own name rather than a box to remember a code for — the field itself still only ever gets the code, the name is just what is on screen. Address, Location and Geospatial share one, each offering what it actually has place data for. Location and Geospatial get that list from the API itself, so a country becomes available here as soon as its data is loaded; if the list cannot be fetched, the place dialog says so rather than guessing, and a country already set on the field is kept either way. Person and Name's own Countries, and Person's Races, are weighted lists over a wider list of their own: a row per country or race, each with its own relative weight, with the item column and the Weight column both labeled once above the rows rather than only ever showing through a placeholder. Add starts another row and − drops one. Races can be left empty entirely — it falls back to a population distribution when it is.
Address, Location and Geospatial narrow where something is generated from in one of three mutually exclusive ways, so Narrow area by is an explicit switch between them — Place, Bounding polygon, or Radius — rather than all three shown at once and left to empty each other out. Choose one and only that one's own settings appear; switch to another, or back to not narrowed at all, and they go away again. Editing an existing field opens already on whichever of the three its own JSON has set.
Place has a dialog of its own, opened from the Choose button beside the summary of whatever is currently set. Five tiers — country, state, county, city, zip — each either a single value or a weighted blend of several, set with its own switch. A blend's row can also name the tiers above it, so a county row can name its country and state and one blend can span more than one of them. Clear all empties every tier; saving with nothing set leaves the field unnarrowed.
Not every country has every tier. Naming one shows only the tiers it actually has place data for, so a country with no postal data does not offer a Zip box that could never match. A tier the country has no data for is still shown if the filter already fills it in, so nothing you set by hand is hidden from you. Include overseas territories appears for a country whose outlying regions are marked, and decides whether naming that country on its own takes them in; it applies only while nothing narrower is named, because naming a region has already said which place is wanted.
The tiers below the country fill themselves in from the API. Name a country and State becomes a dropdown of its regions, listed by name and sending the code for you, with overseas ones marked. Choose one and County and City start suggesting the places inside it as you type — suggestions rather than a dropdown, because a single state can hold close to two thousand cities. Zip has no list, since a country can have tens of thousands of postal areas. All of these are still ordinary boxes: anything the suggestions do not offer can be typed, and a tier whose list cannot be loaded simply stays a box.
A weighted blend's rows do this per row. Set a row's own country and its value list follows that country, so one row can name a county in one country and the next a county somewhere else; a row's State cell becomes a dropdown as well. Leave a row's scope blank and it uses whatever the tiers above it name, as it always has.
Bounding polygon opens a dialog of its own too, from its Draw button. It is Forge: the same map, the same Polygon and Hole tools, the same Undo and the same WKT box, all behaving exactly as they do in the Forge workspace. The difference is only where the shape goes — Forge keeps its own between visits, while this one starts from whatever the field already has and goes back to that field on Save. The row itself shows what is drawn as a count of polygons, holes and points rather than the whole WKT string.
Person's First name, Last name, Middle name and Second middle name each take the same set of settings — a popularity range and its ramp, a race filter, length bounds, a case — which is far too much to show four times over on one form. Each is one row instead, saying how many of its settings are off their default, with an Edit button that opens them. Whatever is typed in there is already on the form behind it, so that dialog only has a Done button; cancelling the field dialog still throws the lot away.
A Person can build up to two identifiers out of the values generated for its own row, and each has a dialog of its own behind a Build button. An identifier is a list of sections joined end to end — a surname's phonetic code, two digits of a birth year, a separator, a check character — one card per section, moved up and down into the order they are joined in. What a card asks for follows the source that section reads from, so a fixed separator asks only for its text while a surname offers a phonetic encoding, a width and a case. Nothing outside that is sent: switch a section's source and whatever was typed under the previous one is dropped rather than carried along.
Calculated has no settings on the form at all beyond its own Calculation
row and a Build button — the whole field is that one tree. A node in it is
a column of the same row, a literal, or an operation over other nodes built the same way,
so an operation's own inputs, and anything else it reads — an If's own When/Then/Else, a
Case's own arms, a Map's own mappings — are each a node editor of their own, nested as deep
as the calculation goes. Choosing an operation shows only the settings it actually reads and
asks for only as many inputs as it actually takes; Round shows a single Decimal places box,
Add shows none at all. Switching to an operation that takes fewer inputs never throws the
extra ones away — they stay on screen, and Save says the count no longer
fits rather than silently dropping one. Else and Default
are the two places a node is optional: unticking the box never clears what was typed under
it, so ticking it again brings back exactly what was there. The row summarizes what is
built, the same way — Upper (1 input), Case · 3 cases.
Every setting each field type takes has a place on the form. What keeps that manageable is that the form only ever shows the ones that mean something right now: a Date under Random shows a different set from the same Date under Sequential, and choosing Lookup replaces the bounds with the list of candidate values. Where two settings cannot be combined the form asks which one you want rather than showing both — one Render as choice rather than a format string and two culture boxes, one Time of day choice rather than an even spread and a clustered one side by side.
Insert adds the field after the last one already in the chosen table, the same placement the plain Insert field button uses, and refuses only when something required is missing, no column is included at all, or the chosen table has no field list to add to, naming which under the form.
Insert table, guided
Insert table always opens a dialog, in either view — a table's own shape never varies the way a field's does, so there is no raw text to drop in as an alternative. It asks for a name, a row count, and an optional primary key: column names, comma separated, that the fields you add afterward will map to. Leaving it blank costs nothing, since the columns usually do not exist yet at the point a table is created.
Insert adds the table after the last one in the payload, with an empty field
list already in place so Insert field has somewhere to add the first one
straight away, and refuses only when the name is empty, the row count is not a positive
number, or the payload has no tables array to add to at all.
Edit or delete a field or table, guided
Hovering a table row or a field row in the outline reveals two small icons at its right edge.
The properties icon opens the same dialog Insert table or Insert field does, with one difference: it opens already filled in with that row's own current settings, its title reads Edit rather than Insert, and its button reads Save. Everything else about the form — the Table dropdown, the type-specific settings, the Map section — works exactly as it does when inserting.
Editing a table writes back only what its own three settings ask for: name, row count and primary key. Its field list is never read or touched, no matter how large it is. As with the Dataset dialog, a setting you clear to blank is removed rather than left as it was — an emptied primary key comes out of the table entirely, not just off the screen.
Editing a field rebuilds the whole field object from the form, the same way Insert does, so the columns and settings on screen when you press Save are exactly what the field ends up with. A property this dialog does not expose — something set by hand in the JSON view that has no row here — survives untouched as long as you leave Type alone; changing Type discards it along with everything else specific to the generator you switched away from, since none of it would mean anything under the new one.
The other icon deletes the row outright, asking first and naming what is about to go. Deleting a table takes every field inside it along with it. Neither has an undo, so a delete you did not mean to make has to be typed back in by hand in the JSON view.
Dataset
Dataset opens a dialog for the payload's own top-level settings: schema version, seed, schema name, schema format, and every CSV formatting override. It is different from the other two dialogs in one way that matters: it edits properties the payload already has, rather than adding something new. It opens showing exactly what is currently set, blank where nothing is, and every field on it is a full statement of what that setting should be once you press Save — blank means the setting should not be in the payload at all, not that it should be left as it was.
A setting already present is updated in place. One that is not is added after the last top-level setting the payload already has. One you clear to blank is removed outright. Nothing about your tables, or any field inside them, is touched by any of this.
The CSV settings are grouped under their own heading and behave as one setting together:
leaving every one of them blank removes the whole group, and setting any of them writes the
group back with only the ones you set. Line terminator, Quote
character, Field delimiter and Escape character
accept a backslash sequence for a value you cannot otherwise type into a text box — a
newline as \n, a carriage return as \r, a tab as \t,
or a literal backslash as \\ — and store the actual character it stands for.
Quote character, field delimiter and escape character are each exactly one character once
that substitution has run, and Save refuses if what you typed comes out to anything else.
Encoding is a dropdown of the character encodings the API accepts, rather
than a text box like the rest of the group.
When a run fails
A failed call is shown in the Settings window, underneath the editor, exactly as the API returned it. That includes the problem type and the detail, so the reason is the API's own words rather than a summary of them. The status pill turns red at the same time.
Table
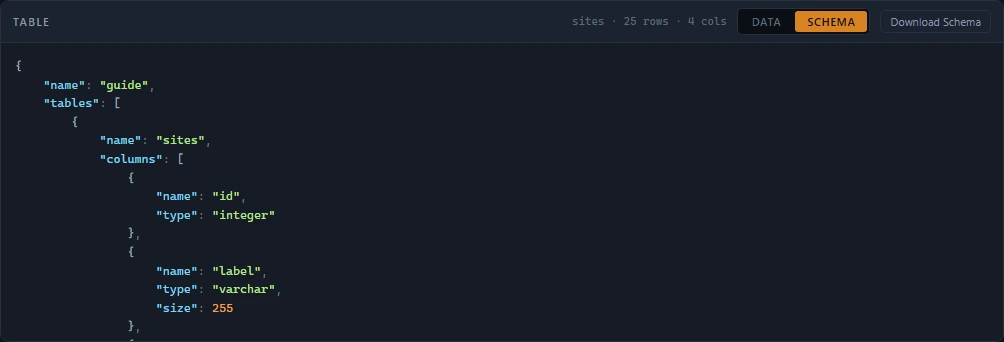
The Table window has two tabs, and each carries its own download button, so what you save is always what you are looking at.
- Data shows the rows, every column in schema order, with Download CSV.
- Schema shows the Velocity schema the request generated, with Download Schema.
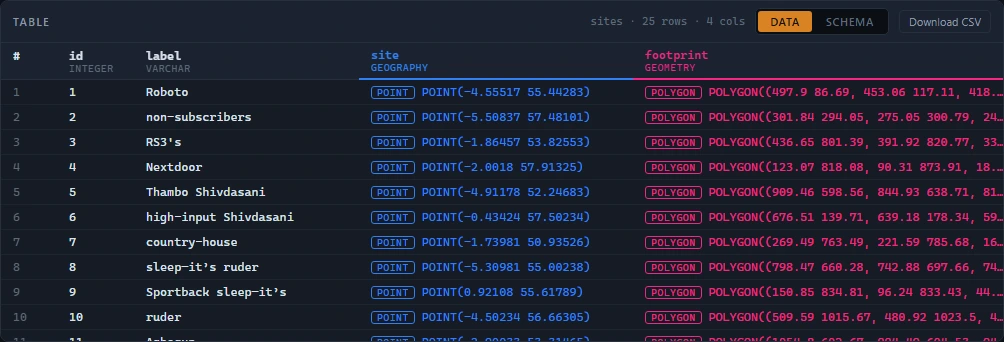
A request that generated more than one table gets a picker in the window bar. Choosing a table repoints the data, the legend and both mapping tabs at it. The picker stays hidden when there is only one.
The bar also reports the table name, its row and column counts, and, when a response is larger than the window will show at once, how many rows are on screen. The rest are still counted and still in the downloaded CSV. They are simply left out of the list.
Columns
Drag the edge of any header to resize that column, and double-click the edge to put it back to the width it started at. Columns start at the width their content asked for, capped so that one long geometry cannot take the whole table.
A column whose type is Geometry or Geography is given a color. That
same color is used for its header, its cells, its entry in the legend and its shapes on the
map, so a shape can be traced back to the column it came from at a glance. Spatial cells are
prefixed with their WKT type and carry the full text on their tooltip.
An empty value is shown as a dim null rather than as blank space.
Selecting a row
Click a row to select it. The geometry grid highlights that row's shapes and the map flies to them. It works the other way round too: clicking a shape on either mapping tab selects its row and scrolls the table to it.
Mapping
Two tabs, each enabled only when the response justifies it. A tab is available when at least one column of that type came back, and both stay disabled when none did.
Geometry
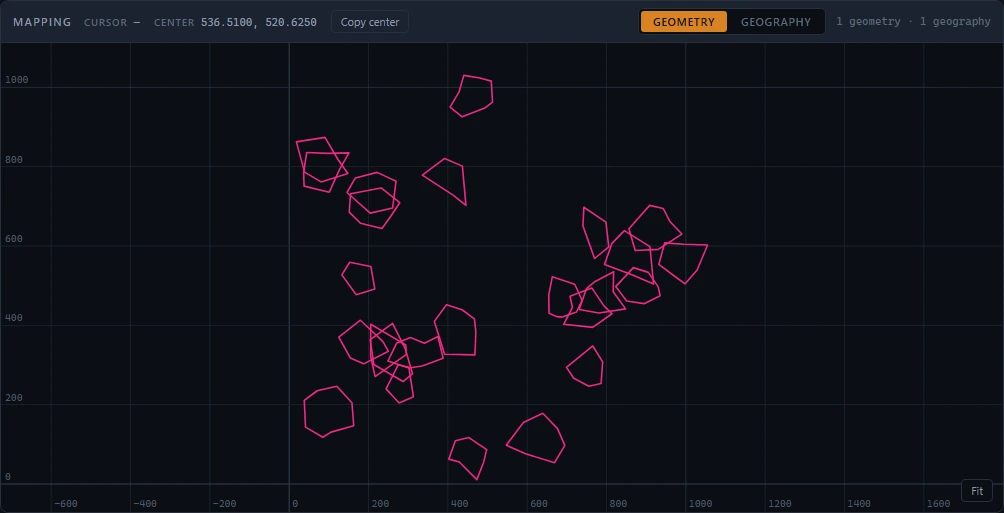
Planar coordinates plotted on graph paper. A Geometry column carries plain numbers
with no stated projection, so they are plotted as they are rather than pushed onto a map of
the world. Scroll to zoom, drag to pan, and Fit to frame everything again.
Geography
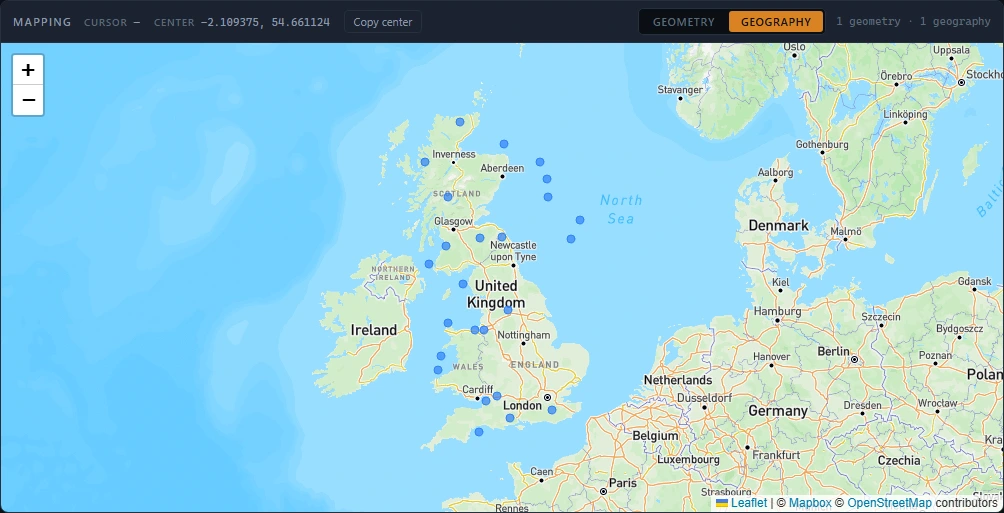
Longitude and latitude on a real map, one layer per column. Coordinates are read as longitude then latitude, the order WKT itself uses, so nothing is reordered on the way in.
Reading coordinates
Both tabs report the coordinate under the pointer and the coordinate at the center of the view in the window bar. Each tab keeps its own pair, so switching between them shows that view's numbers rather than the other one's.
Copy center puts the center on the clipboard as two properties on their own, ready to paste into a field that already has its braces:
"centerX": -3.120117,
"centerY": 54.76267
The legend
Every spatial column appears in the legend under the payload editor, in its own color. Click an entry to hide that column on both tabs, and click it again to bring it back. Hiding a column also takes it out of what Fit frames.
Hovering a shape names its column, its row number and its WKT, along with the value of the table's first column so the shape can be tied back to something readable. That last part is left out when the first column is itself spatial, since another geometry would say nothing useful there.
Explore
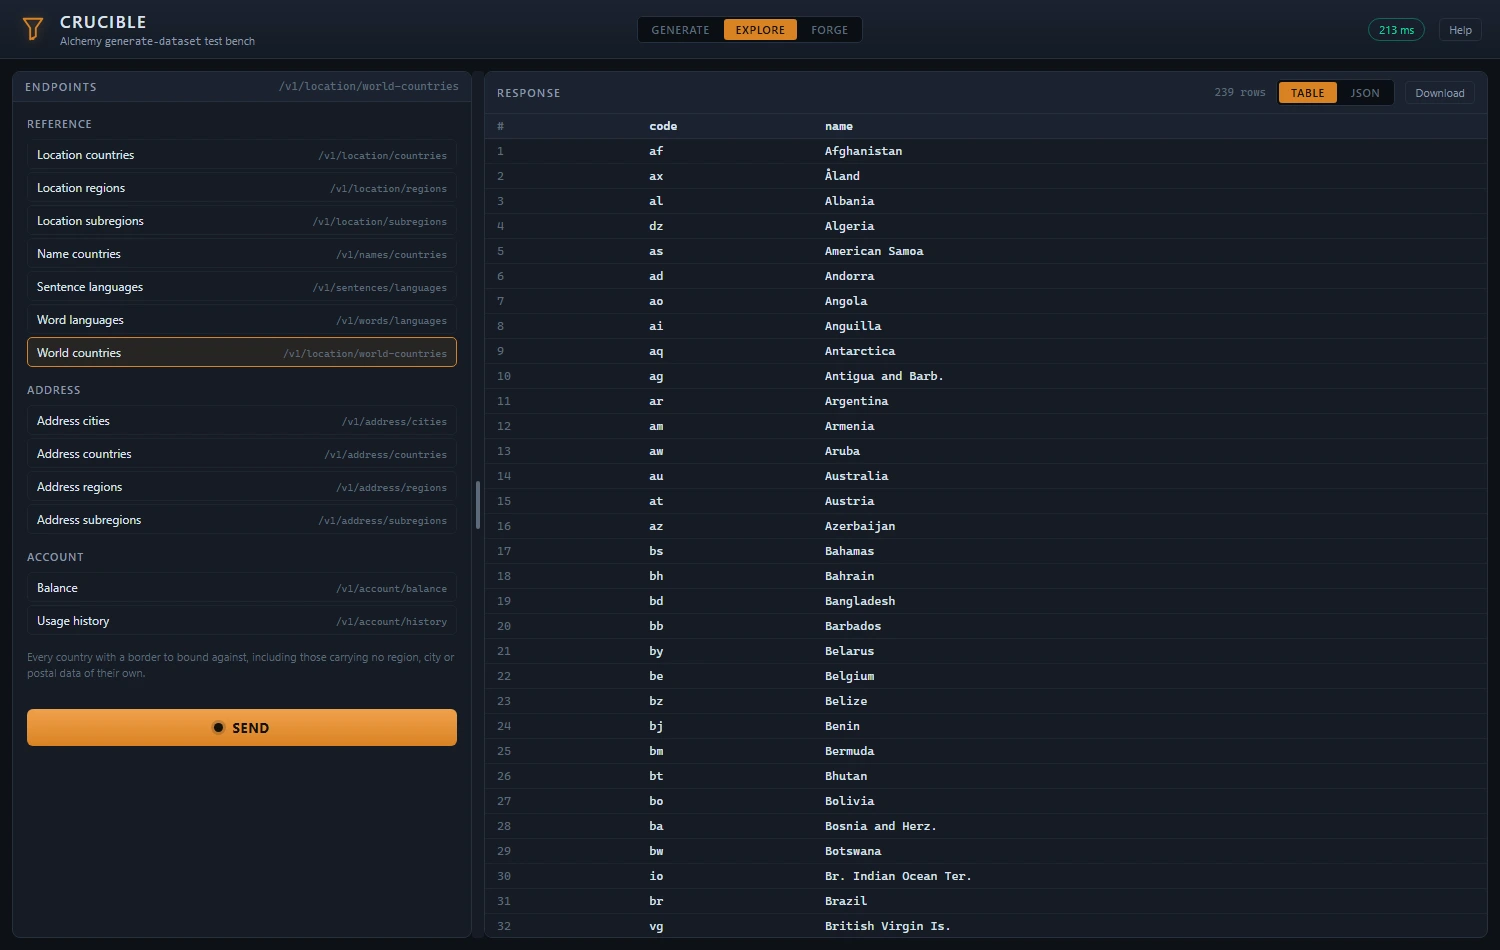
The lookup endpoints, grouped as Reference, Address and Account. These return reference data rather than generating anything, so they are kept out of the Generate flow entirely. Choose one from the list on the left and its path appears in the window bar.
Parameters
Parameters are offered as values wherever the API can supply them, so there is nothing to look up and nothing to spell. A country is a dropdown filled from the countries endpoint, and a region is filled from the regions of whichever country is currently selected, reloading when that changes. Lists already fetched are reused, so stepping back up a chain of dropdowns and down again does not fetch them twice.
Send runs the call. The status pill reports it the same way a run does.
The response
Shown as a Table or as raw JSON, whichever tab you choose, with Download saving the response as JSON.
An endpoint that pages returns a cursor, and Next page appears when it did. The cursor is carried forward for you rather than typed. The button is hidden when the response did not return one, which is how you know you have reached the end.
Forge
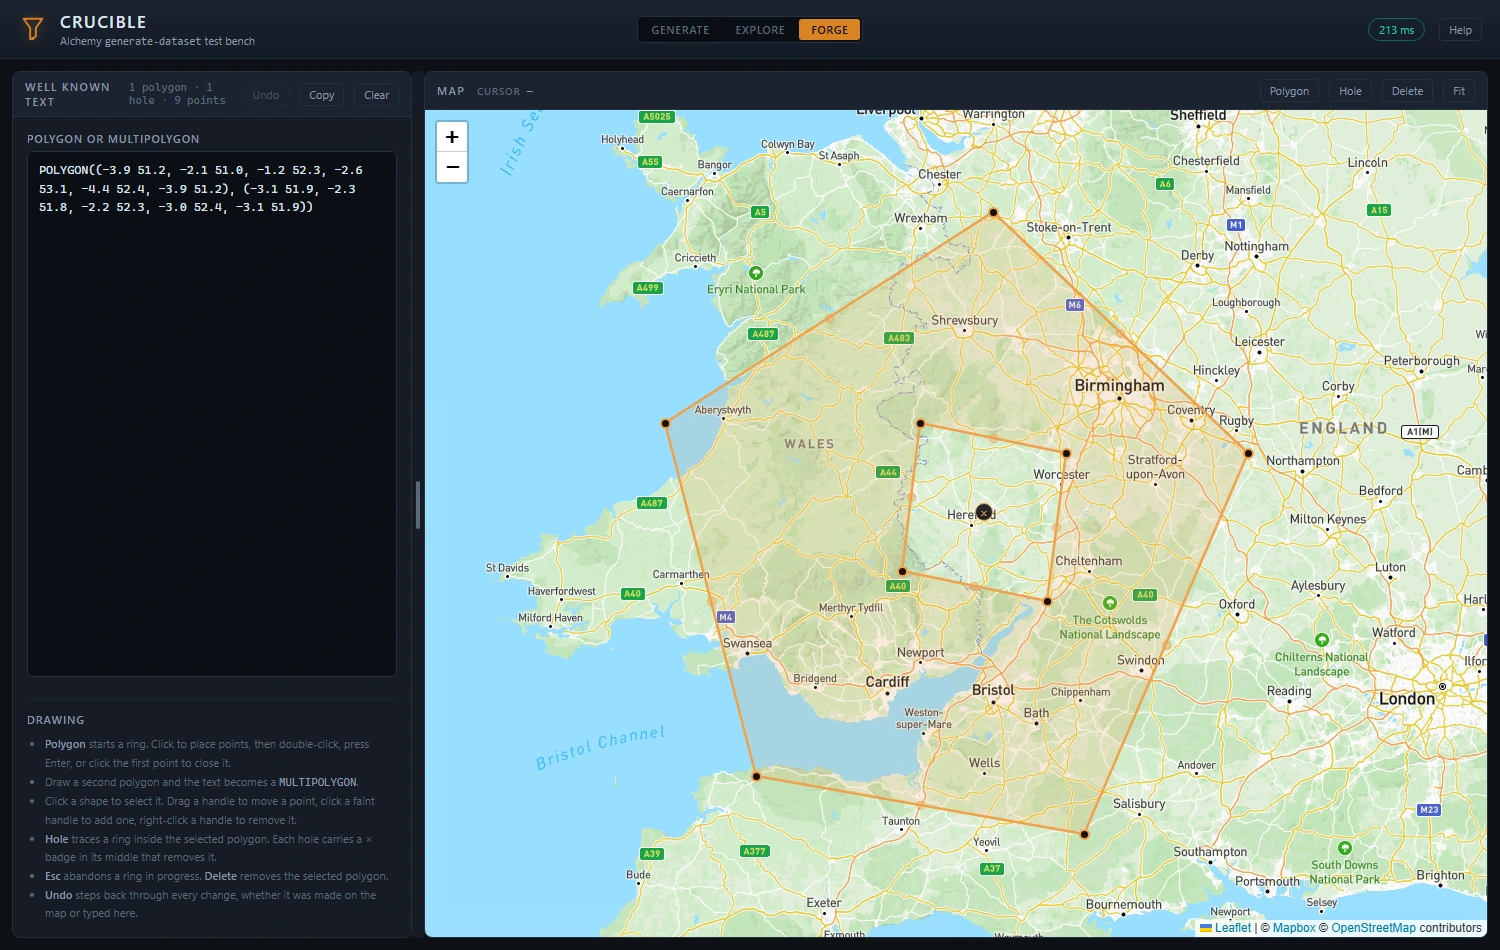
Forge builds polygons for use as a spatial filter in a payload, without writing the coordinates out by hand. The WKT box on the left and the map on the right are two views of the same polygons, and either one can be edited.
Paste a POLYGON or MULTIPOLYGON into the box and it is drawn.
Draw or edit on the map and the box is rewritten. The side edited last is the one the other
follows.
Drawing
- Polygon starts a ring. Click to place points, then double-click, press Enter, or click the first point to close it.
- Esc abandons a ring in progress and Backspace drops its last point.
- Draw a second polygon and the two become a
MULTIPOLYGON.
While a ring is open the cursor is a crosshair and the shapes already on the map stop responding to clicks, so a point placed over an existing polygon lands where you put it instead of selecting something.
Editing
Click a shape to select it. The selected polygon turns amber and grows a handle on every vertex.
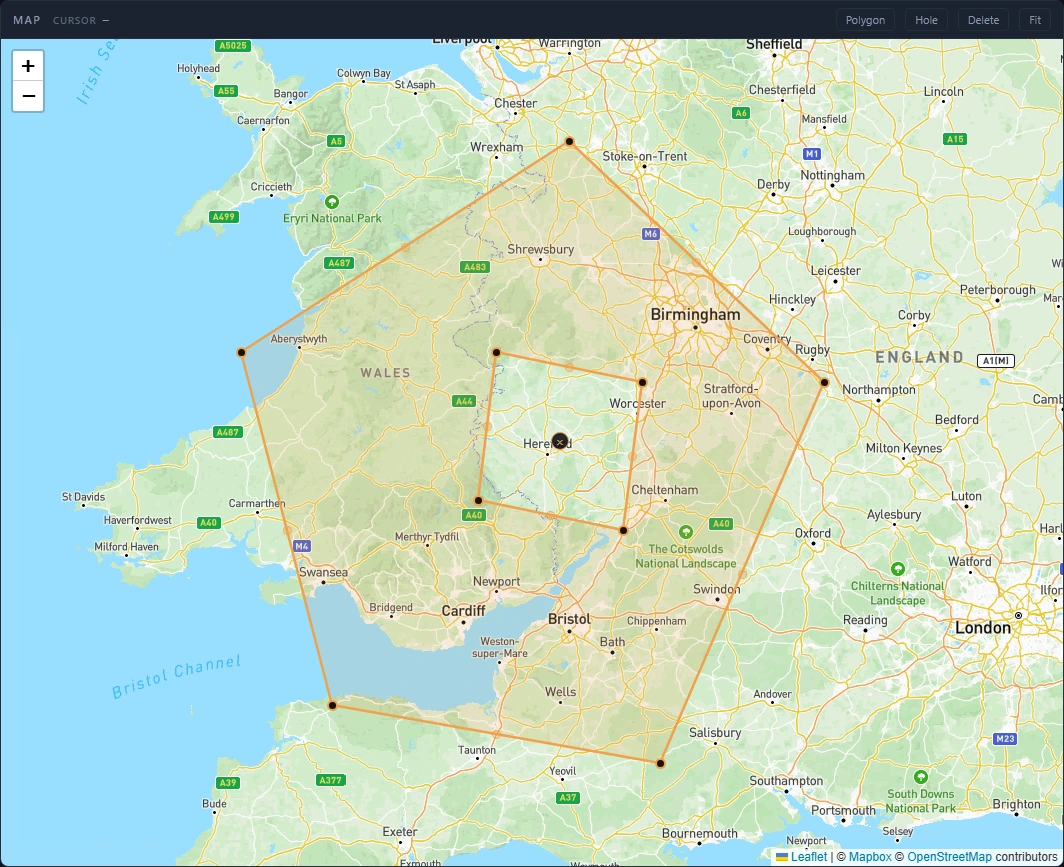
- Drag a handle to move that point.
- Click a faint handle on the middle of an edge to add a point there.
- Right-click a handle to remove that point. A ring that would fall below three points is removed instead, and removing the exterior ring removes the polygon along with its holes.
- Delete removes the selected polygon outright.
Holes
Hole traces a ring inside the selected polygon. It is only available once a polygon is selected, since a hole needs something to be a hole in.
A ring that is not wholly inside the polygon is rejected and said so, rather than written out as a shape that is not valid. Each hole of the selected polygon carries a small badge in its middle that removes it, because a hole has no fill for a click to land on.
Undo
Undo steps back through every change, whether it was drawn on the map or typed in the box. A run of typing counts as one step rather than one per keystroke, so undoing after a bad edit takes you back to the last text that parsed. Ctrl+Z does the same while the map has focus, and inside the box it is the box's own undo, which redraws the map as it goes either way. Undo deliberately leaves the view where it is, since a correction is not a reason to move the map.
Using what you built
Copy puts the WKT on the clipboard in quotes, ready to paste straight in as a value:
"boundingPolygon": "POLYGON((-74.3 40.5, -73.7 40.5, -73.7 40.9, -74.3 40.9, -74.3 40.5))"
One polygon is written as POLYGON and several as MULTIPOLYGON. Text
pasted in as a MULTIPOLYGON keeps that type even after it has been edited down
to a single polygon, so a round trip never changes it underneath you. Which fields accept a
polygon filter, and what it does to the rows they generate, are questions for Alchemy's own
documentation.
The window bar counts what you have drawn, and the text survives a reload, so a polygon you were part way through is still there tomorrow. Clear removes everything, and Undo brings it back.
Keyboard shortcuts
| Keys | Where | What it does |
|---|---|---|
Ctrl+Enter | Anywhere | Runs the payload |
Tab | Payload editor | Indents by four spaces |
Shift+Tab | Payload editor | Outdents |
Enter | Forge, drawing | Closes the ring |
Esc | Forge, drawing | Abandons the ring |
Backspace | Forge, drawing | Drops the last point placed |
Delete | Forge, map | Removes the selected polygon |
Ctrl+Z | Forge | Undoes the last change |
Arrow keys | Payload outline | Move through the outline, Left and Right fold and unfold |
Enter | Payload outline | Jumps to that property in the JSON |
Arrow keys | A window divider | Moves it, holding Shift to move further |
Every divider between two windows can also be dragged, and double-clicking one puts it back to its default width. Where you leave it is remembered.
Troubleshooting
The call was rejected
The error panel shows what the API returned, word for word. An authentication failure means the key in the box is missing, mistyped or not valid for this environment. Anything else is the API's verdict on the payload, and the detail it returned is the thing to read.
Nothing happens when I press Run
Check the hint under the editor first. A payload that is not valid JSON never leaves the browser, and the hint names the parse error and where it is.
The mapping tabs are grayed out
Neither tab is enabled unless the response actually contained a column of that type. A payload with no spatial field produces no spatial column, and the window says so in place of a map.
The map is empty although the table has geometry
Check the legend. A column hidden there is hidden on both tabs. Click its entry to bring it back, then press Fit.
Forge says the text is not readable
Forge builds areas, so it takes POLYGON and MULTIPOLYGON and
nothing else. A point or a line is read correctly and then turned down for being the wrong
shape, which the hint says. The map is left alone whenever the text cannot be used, so a
half-typed edit never wipes what you had drawn.